t-test & the Null Hypothesis
Lets say you have two sample groups. We want to determine if their mean values are different.
Image Credit: http://aidsetc.org/target/fxbclinicalresearch/Module1/mod1s9.htm
For research purposes, we always start with the Null Hypothesis - the assumption that there is no difference between the two means.
In the example above, we use a t test for independent means to try and disprove the Null Hypothesis.
To determine the value needed to reject the Null Hypothesis, we need to refer to a table (see below).
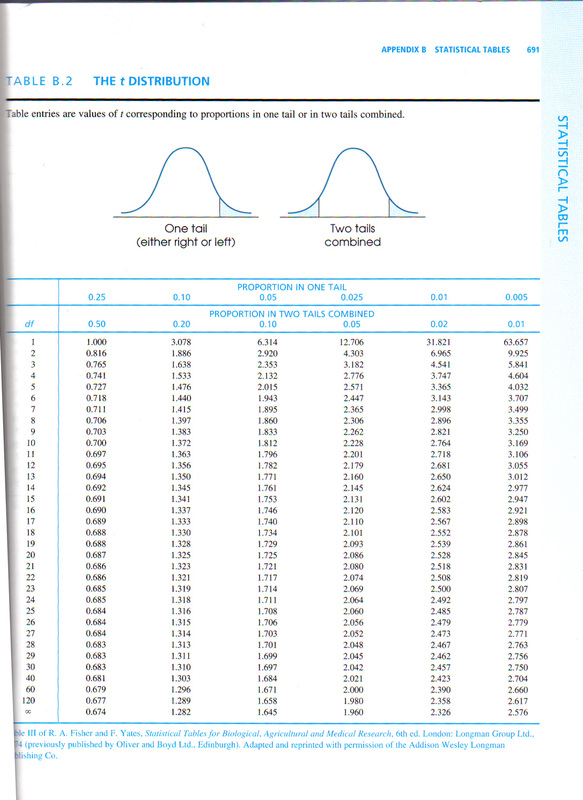
In this table, we will focus on two-tailed values, and on a significance level of 0.05 (i.e. p = 0.05).
The significance level is provided in the top row, and we usually want a level of 0.05 or 0.01.
You will note from the table, we first need to know our df (degrees of freedom).
The significance level is provided in the top row, and we usually want a level of 0.05 or 0.01.
You will note from the table, we first need to know our df (degrees of freedom).
Degrees of Freedom

If group A has 15 people and group B has 17 people,
df = (15 - 1) + (17 - 1) = 30
i.e.,
df = (nA - 1) + (nB - 1)
Image Credit: http://mathbench.umd.edu/modules/statistical-tests_chisquare_advanced/page13.htm
df = (15 - 1) + (17 - 1) = 30
i.e.,
df = (nA - 1) + (nB - 1)
Image Credit: http://mathbench.umd.edu/modules/statistical-tests_chisquare_advanced/page13.htm
Rejecting the Null

We now have all the pieces of information to either accept the Null Hypothesis or to reject it.
In the table above, we want the two-tailed test, and a significance level of p=0.05
Our df as we know = 30
Run down the column for 0.05 till you reach the row for df=30. The value in the table is 2.042. This is the critical value that we need if we want to reject the null hypothesis.
So when we run our t-test (using SPSS), if we obtain a value that is greater than 2.042, we can reject the Null hypothesis.
Q: What happens if we can't reject the Null?
A: Too bad :)
It could indicate that the difference you observe between the means of the 2 groups are due to chance or sampling error, etc.
Type I and Type II Errors

We don't often know what reality is. But we can try to collect evidence to clue us in on what possibly is happening.
However, as we know it, sometimes our evidence can lead us down the wrong path, and we commit an error.
There are 2 types of errors in hypothesis testing.
Type I error - There is actually no difference between the means of 2 groups, but we reject the null hypothesis based on our analysis. Meaning, we find the 2 groups "guilty" of being different.
Type II error - There is actually a difference between the means of 2 groups, but we don't reject the null hypothesis. Meaning, we find no evidence the 2 groups are different.
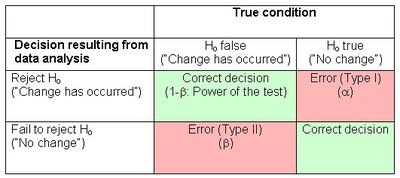
Image credit: http://www.epa.gov/bioiweb1/statprimer/power.html
