Distribution of Data
For all following chapters, lets use continuous variables in helping us understand this course.
Lets say you have 1000 students who answered your survey.
That’s an impressive number. Good job!
For the item:
I feel sad…..
1. Never 2. Some days 3. Most days 4. Every day
How would you think students in your school would answer this?
How many would select 1?
How many 2?
How many 3?
How many 4?
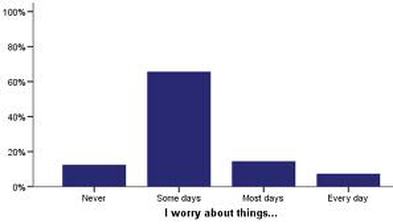
Looking at how students spread themselves across these 4 possible response option is known as distribution.
How could you display this distribution of results?
The most common way is to use a bar chart (histogram).
Lets say you have 1000 students who answered your survey.
That’s an impressive number. Good job!
For the item:
I feel sad…..
1. Never 2. Some days 3. Most days 4. Every day
How would you think students in your school would answer this?
How many would select 1?
How many 2?
How many 3?
How many 4?
Looking at how students spread themselves across these 4 possible response option is known as distribution.
How could you display this distribution of results?
The most common way is to use a bar chart (histogram).
Mean, Median, Mode
How does one determine the mean, median and mode? The first video shows you how to do this in Excel, while the second shows you how to do this in SPSS.
