Normal Curve
From here on, its all about our curves :)
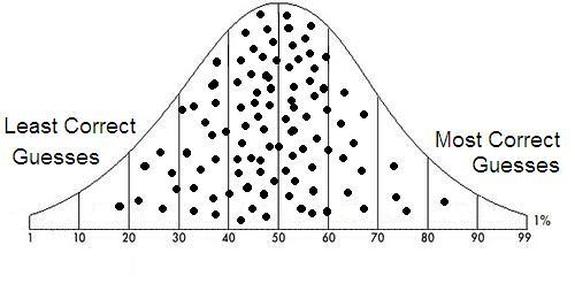
Distribution curve - how our scores are spread for a particular scale
Distribution curve - how our scores are spread for a particular scale
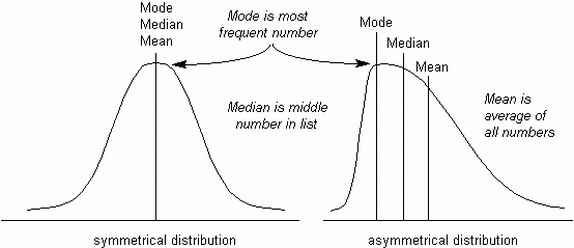
Mean, Median, Mode & Range
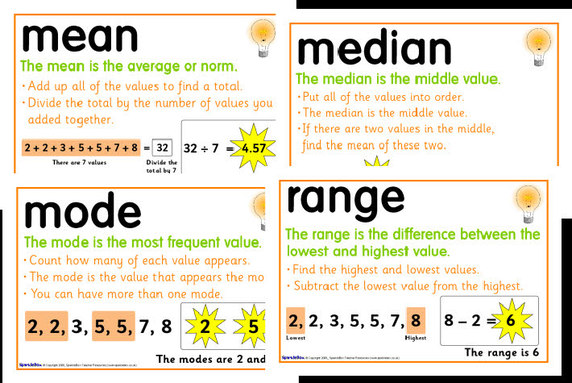
Image from SparkleBox
Mean / average = the sum of all scores for all students
the number of students
Mode = what is the most frequent score, i.e. what did most students report
the number of students
Mode = what is the most frequent score, i.e. what did most students report
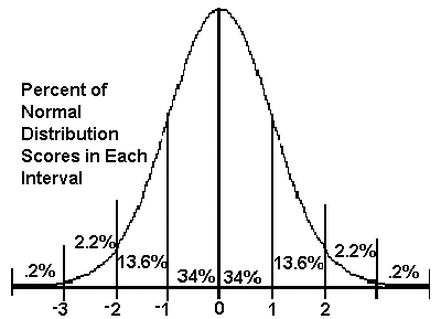
Standard Deviation
Ref: CAST in section 2.5.7
