How to run a correlation on SPSS
Lets say we were interested if there’s an association between question 1 (on depression) and question 5 (on bullying). To do this, we could run a correlation.
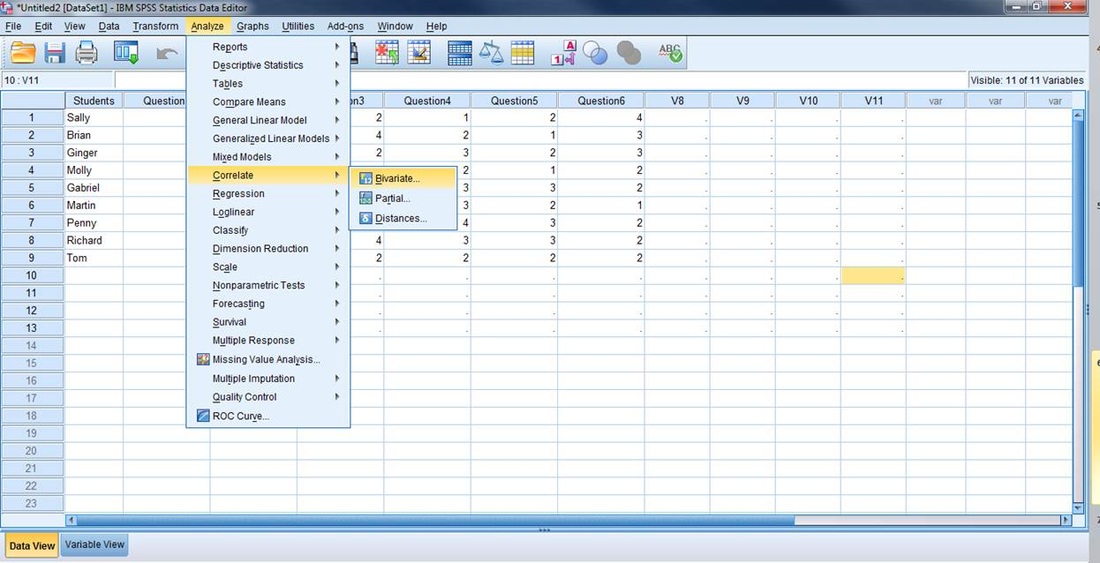
How do we run a correlation on SPSS?
Open SPSS and look at the top menu.
Go to Analyze --> Correlate --> Bivariate
How do we run a correlation on SPSS?
Open SPSS and look at the top menu.
Go to Analyze --> Correlate --> Bivariate
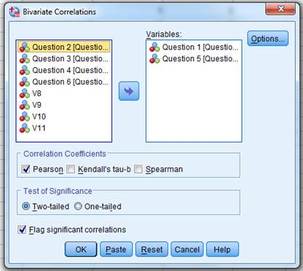
A box will appear like the one on our right.
Move question 1 and question 5 from the left column to the right column, and click OK
Results will appear on a separate output sheet and you will see the table like the one below:
Move question 1 and question 5 from the left column to the right column, and click OK
Results will appear on a separate output sheet and you will see the table like the one below:
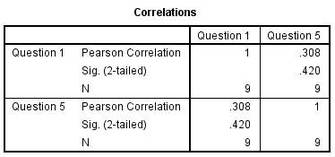
So the correlation between question 1 and 5 is .308 (see table on right).
This looks impressive.
But, is it really?
We need to determine if this is significant.
From the same table we see the significance is listed as .420.
So, here, the association between question 1 and 5 is not significant.
Wait a minute! How do we know?
See the next page
This looks impressive.
But, is it really?
We need to determine if this is significant.
From the same table we see the significance is listed as .420.
So, here, the association between question 1 and 5 is not significant.
Wait a minute! How do we know?
See the next page
Below are two videos that demonstrate how you could run a correlation using SPSS.
A quick comment on what we just did.
You would notice that we looked at the correlation between question 1 and question 5.
This is not quite accurate.
Say what?
We really want to look at the correlation between depression and bullying. This involves first creating a scale for depression and a scale for bullying. Each scale would consist of a number of items that helps us better gauge if someone is depressed or someone has been bullied.

The point of this lecture has been to assure you that you don’t have to worry too much about calculating statistics. The software will do this for you.
However, you would need to understand some basics in statistics. This will help you make sense of things like correlations.
Ready for the stats journey?
Lets go.
However, you would need to understand some basics in statistics. This will help you make sense of things like correlations.
Ready for the stats journey?
Lets go.
